Data Visualization
How to visualize the data collected by the execution of your custom pipeline depends a lot on the nature of collected data itself.
In many situations what is required is to visualize the data collected by your pipeline over a period of time, or as it is called: time series data.
Examples of time series data are:
- Evolution of the code coverage of your project over time.
- Internet speed of a system over time.
- CPU load of a system over time.
- Number of tests implemented, passed, failed or skipped in your project over time.
- Temperature, humidity, and barometric pressure submitted by sensor over time.
We could implemented a custom application using visualization libraries like Bokeh, which provides great flexibility and features for data visualization.
But in most cases, a general purpose tool for data visualization that provides dashboards is more than enough and provides all the flexibility to plot more and more data types as your custom pipeline keeps growing.
This tools requires to consume data from one of your sinks. Both Grafana and Chronograf are able to consume from InfluxDB, which is supported by the built-in InfluxDBSource.
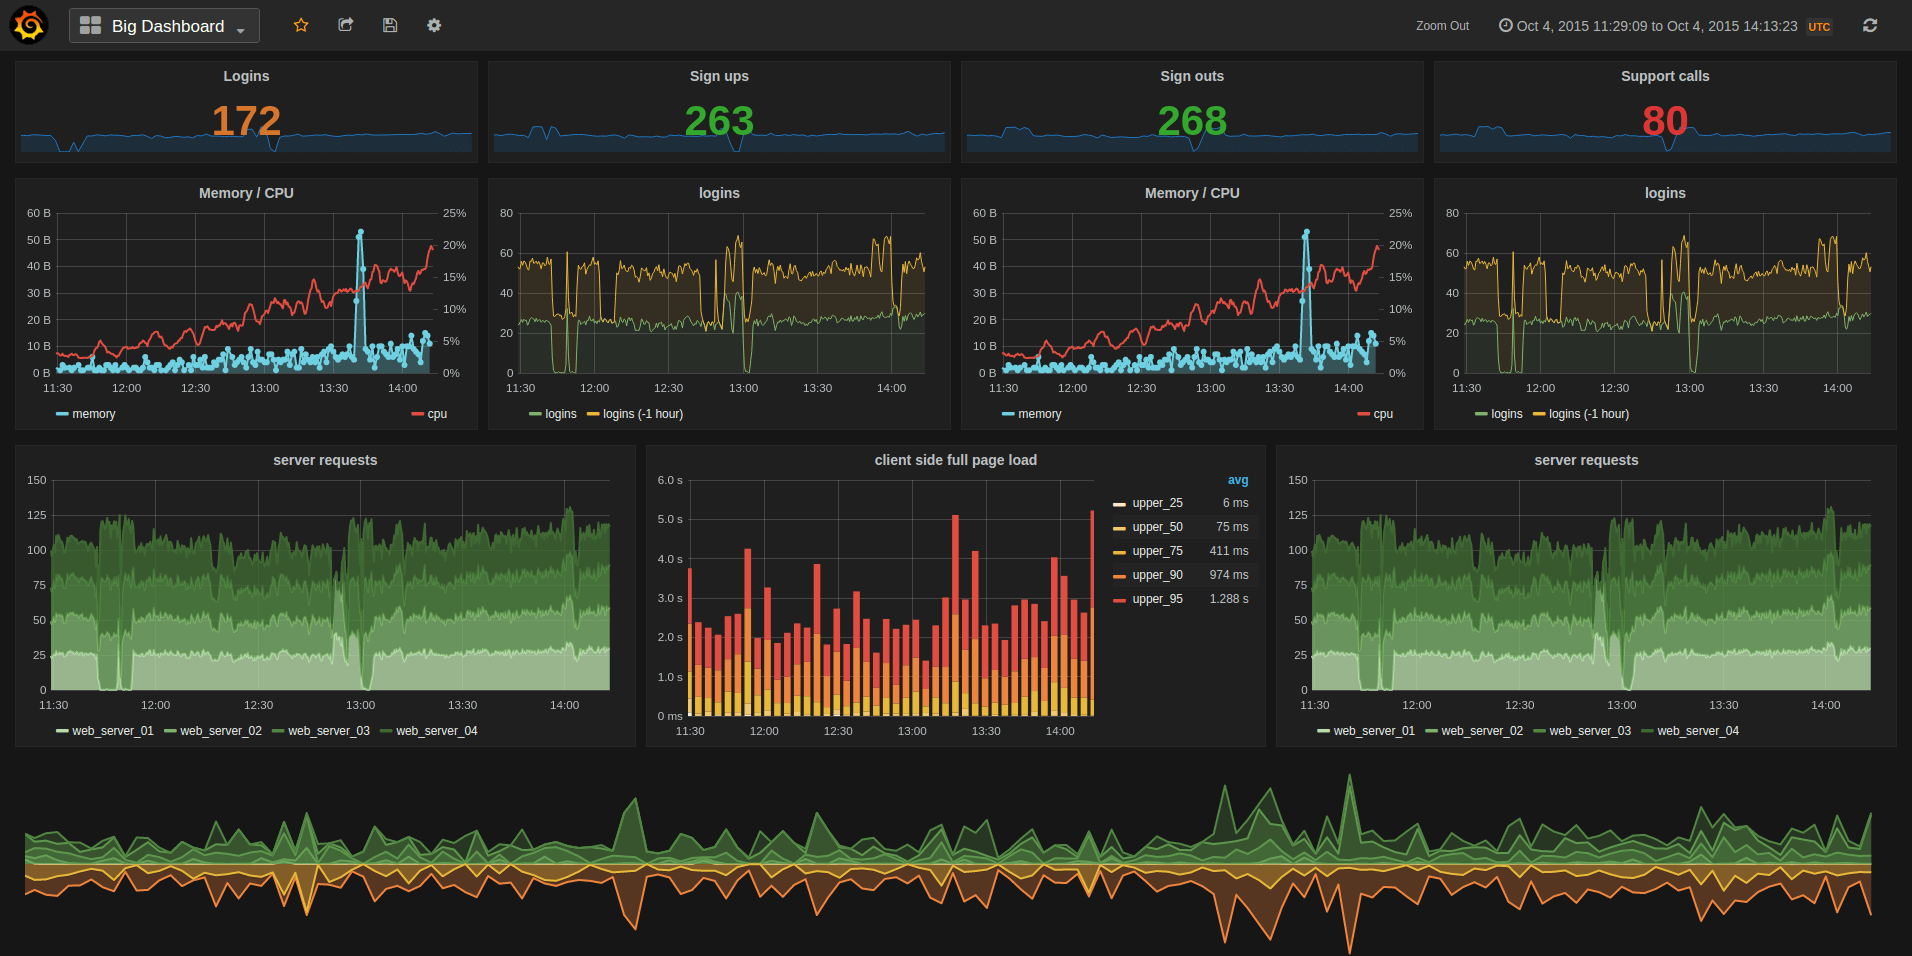
Grafana
Grafana provides an Open Source web based application that allows to define dashboards with panels to visualize data from several sources:
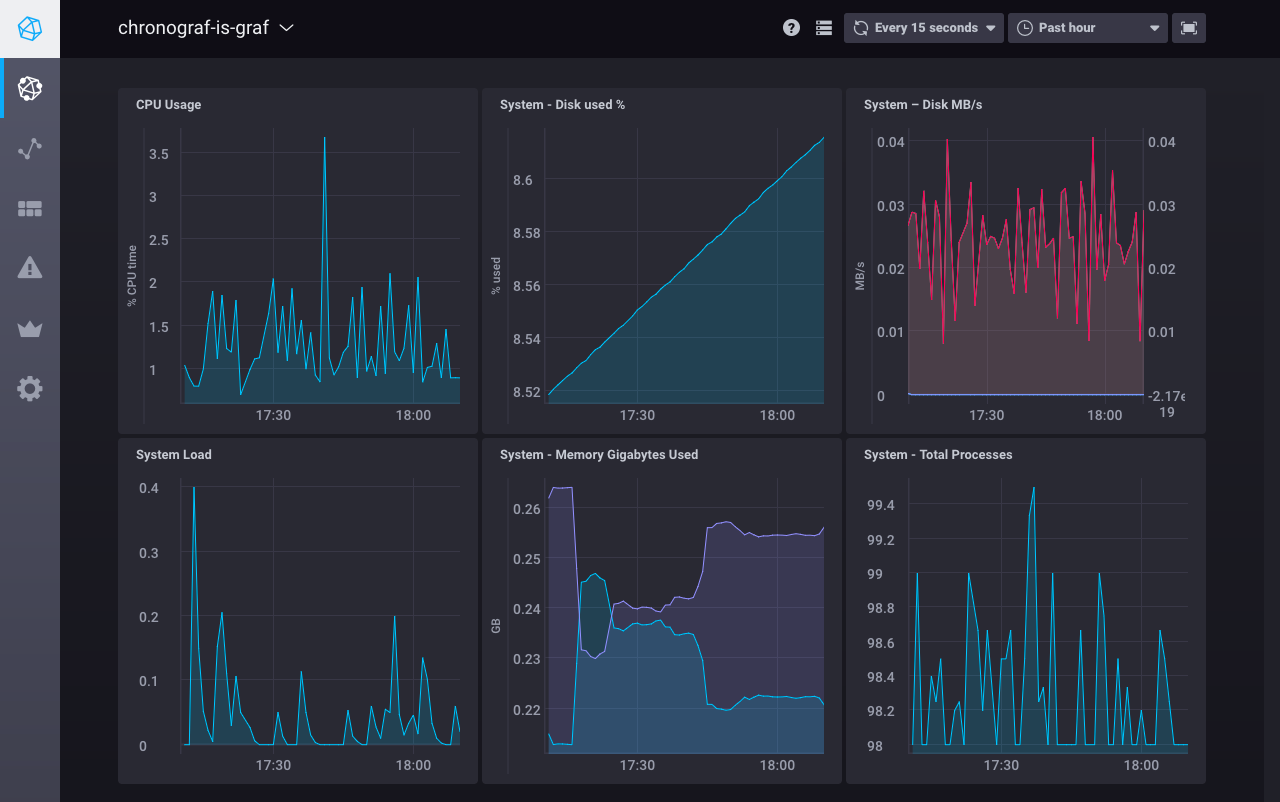
Chronograf
Similar to Grafana, Chronograf allows to plot data from the InfluxDB time series database in an easy to use Open Source web application.
Chronograf is part of the stack developed by InfluxData, the company behind InfluxDB.